
How the MVRV Ratio Can be Used to Predict Bitcoin Price Movements
Introduction
The MVRV Ratio, or Market-Value-to-Realized-Value Ratio, is a powerful tool for crypto investors, particularly those involved in Bitcoin. As Bitcoin grows in prominence, understanding the MVRV Ratio can offer critical insights into market conditions, investor sentiment, and potential price movements.
What is the MVRV Ratio?
The MVRV Ratio is a metric that compares the market value of a cryptocurrency to its realized value. The market value is simply the current price of the cryptocurrency multiplied by the total supply in circulation. On the other hand, realized value considers the price at which each coin last moved. This means that realized value reflects the actual cost basis of all holders, offering a more grounded perspective on market behavior.
A live chart of the MVRV Ratio can be found here.
A variation of the MVRV Ratio is the MVRV Z-Score which standardizes the MVRV Ratio by the standard of the circulating market value.
Formula for MVRV Ratio
The MVRV ratio is calculated using the following formula:

Where:
- Market Value is the current price of Bitcoin multiplied by the circulating supply.
- Realized Value is the value of all Bitcoins at the price they were last moved.
Why is the MVRV Ratio Important?
For investors, the MVRV Ratio serves as an indicator of market sentiment and potential price reversals. By comparing two different valuation models of Bitcoin, investors can get a feeling of if the current price is overvalued or undervalued. When the MVRV Ratio is high, it suggests that the market value is significantly higher than the realized value. This often indicates that Bitcoin is overvalued, and a correction may be on the horizon. Conversely, a low MVRV Ratio suggests that the market value is below the realized value, potentially signaling undervaluation and a buying opportunity.
How to Interpret the MVRV Ratio
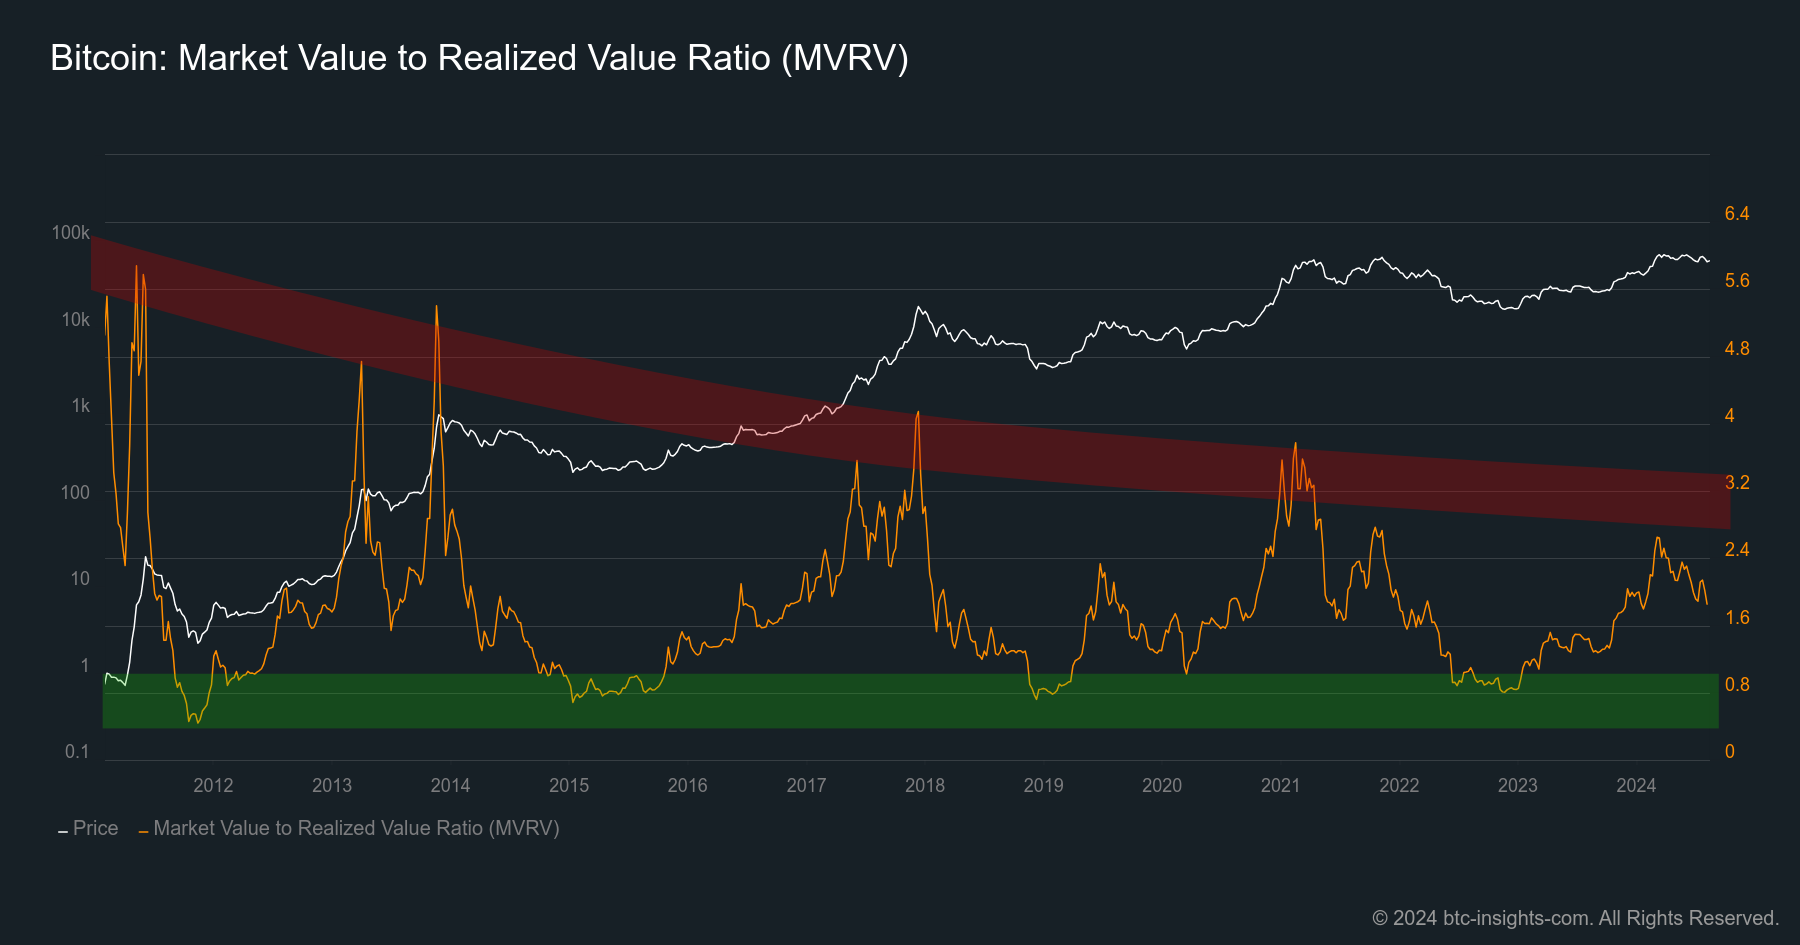
The MVRV Ratio is often used to identify the extremes in market cycles. Historically, an MVRV Ratio above 3.7 has been associated with market tops, while a ratio below 1.0 has indicated market bottoms. However, as Bitcoin grows in adoption and therefore in market value the upper top decreases in every cycle as visualized in the image above. The thresholds also can vary depending on market conditions and investor behavior.
MVRV Above 3: A Cautionary Signal When the MVRV Ratio climbs above 3, it suggests that the market is overheating. Prices have risen significantly, and many holders are sitting on substantial unrealized profits. This scenario often precedes a market correction, as investors may begin to take profits, leading to selling pressure.
MVRV Below 1.0: A Buying Opportunity On the flip side, when the MVRV Ratio dips below 1.0, it indicates that the market value is less than the realized value. In simpler terms, the current price is lower than what most investors paid for their holdings. This situation often presents a buying opportunity, as it suggests the market is undervaluing the asset.
Historical Application of the MVRV Ratio
Especially the lower bound of the MVRV historically was able to predict the market cycle bottom with high accuracy. In 2019 as well as in 2022, early 2023 the MVRV bottomed around 0.8. Investors who recognized this as a signal of undervaluation and bought Bitcoin were rewarded with significant gains as the market recovered and entered a new bull cycle.
The tops of the market cycles are not so clear. MVRV toped around 4.7 late 2017, and 4.0 early 2021. But anyone who has fitted a logarithmic curve to the last peaks has certainly got a good feel for when the market is overvalued and a correction is due.
Conclusion
The MVRV Ratio is an essential metric for Bitcoin investors seeking to understand market conditions and make informed decisions. By comparing the market value to the realized value, it provides insights into whether Bitcoin is overvalued or undervalued. However, like all tools, it should be used as part of a broader investment strategy, considering other indicators, like the NUPL or the RHODL Ratio and market dynamics.
Author's Disclaimer: This article has been written for informational purposes only. It shall not be seen as financial advice in any shape or form.
