
How to analyze Bitcoin Supply in Profit and Loss
Why should I analyze the Supply in Profit and Loss?
Analyzing metrics to access the profitability of current Bitcoin holders is important for accessing market sentiment. The Supply in Profit and Loss metric is an excellent entry point for this.
What is the Bitcoin Supply in Profit and Loss
The supply in Profit and Loss is the percentage of total supply that has last been moved at an average buy price that is lower or higher than the current price.
It ranges from 0 to 1, meaning all supply is in profit or loss or vice versa. The metric does not take into account by how much the supply is in profit or loss.
It is worth noting that the metric by definition also includes lost coins and those coins that haven’t moved in years which generally tend to be in profit.
How is the Supply in Profit and Loss calculated?
Supply in Loss is the percentage of supply whose price when it last moved was higher than the current price.
Supply in Profit is the percentage of supply whose price when it last moved was lower than the current price.
Supply in Profit and Loss for all Bitcoin Holders
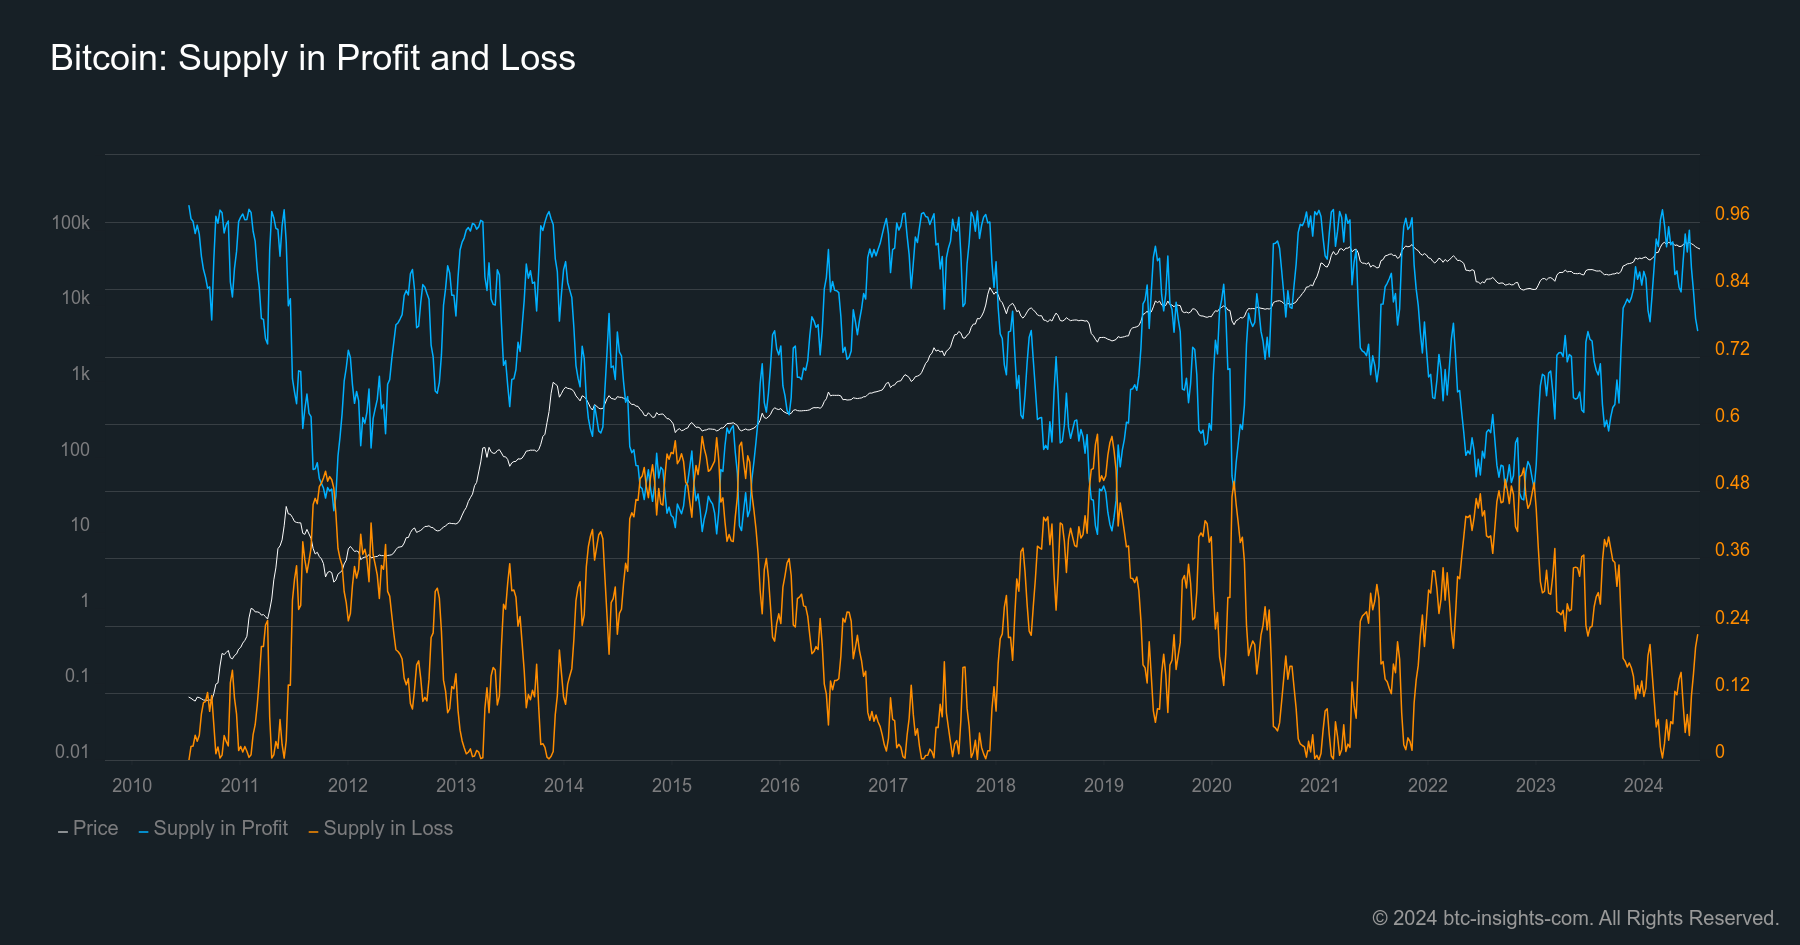
The overall supply in profit or loss includes all bitcoin transactions. It is a oszillating chart with some noise – mainly due to the short-term holder actions – but tracks the overall bitcoin cycles very well.
On the way to new all time highs each cycle the supply in profit increases and the supply in loss decreases naturally. A supply in profit of 1 (or 100%) in the short term leads to price pressure as holders take profits. Historically the supply in profit and loss tends to overlap for a short period in the bear markets, making it a good bottoming indicator.
The live chart can be found here.
Short-Term Holder (STH) Supply in Profit and Loss
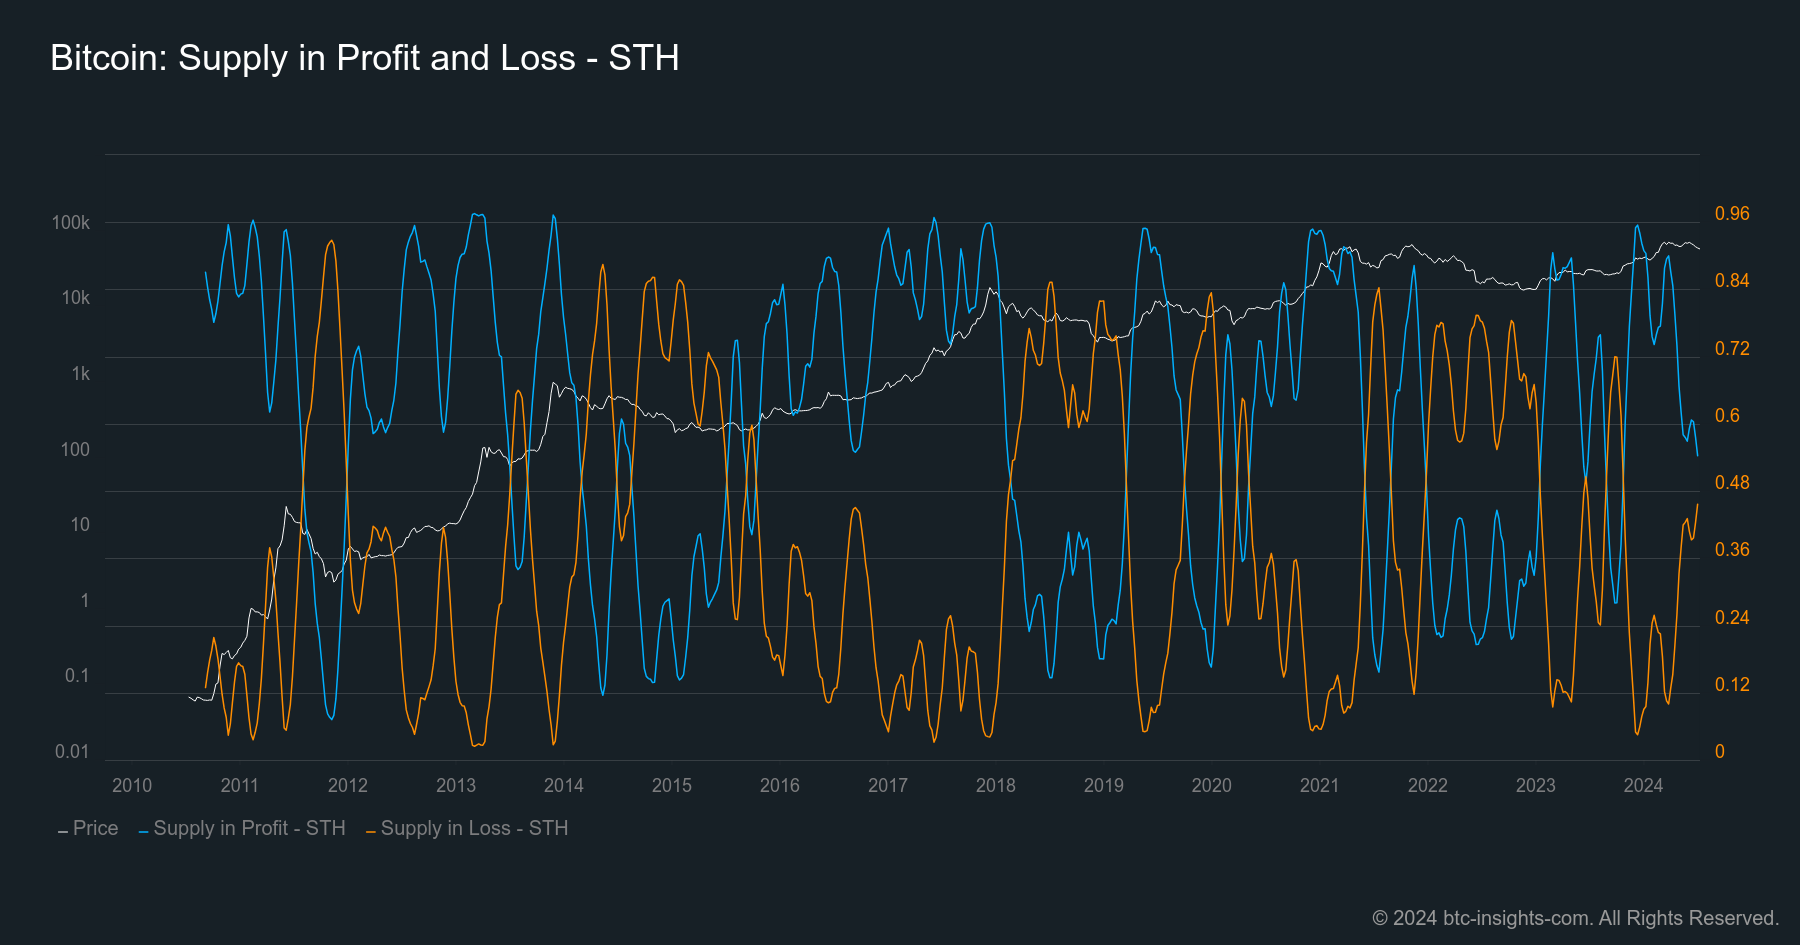
The short-term holder supply in Profit and Loss only takes into account only the supply that was last moved within the last 150 days. It is a very noisy chart which is why it is best analyzed with a longer term moving average. The chart above shows the STH supply in Profit and Loss with a 50d moving average.
This metric is not used to track cycle bottoms or tops but rather to understand short term price action. For example the STH supply in loss tends to top out with values around 0.9 before some upwards price action brings the most recent supply in profit again.
The live chart can be found here.
Long-Term Holder (LTH) Supply in Profit and Loss
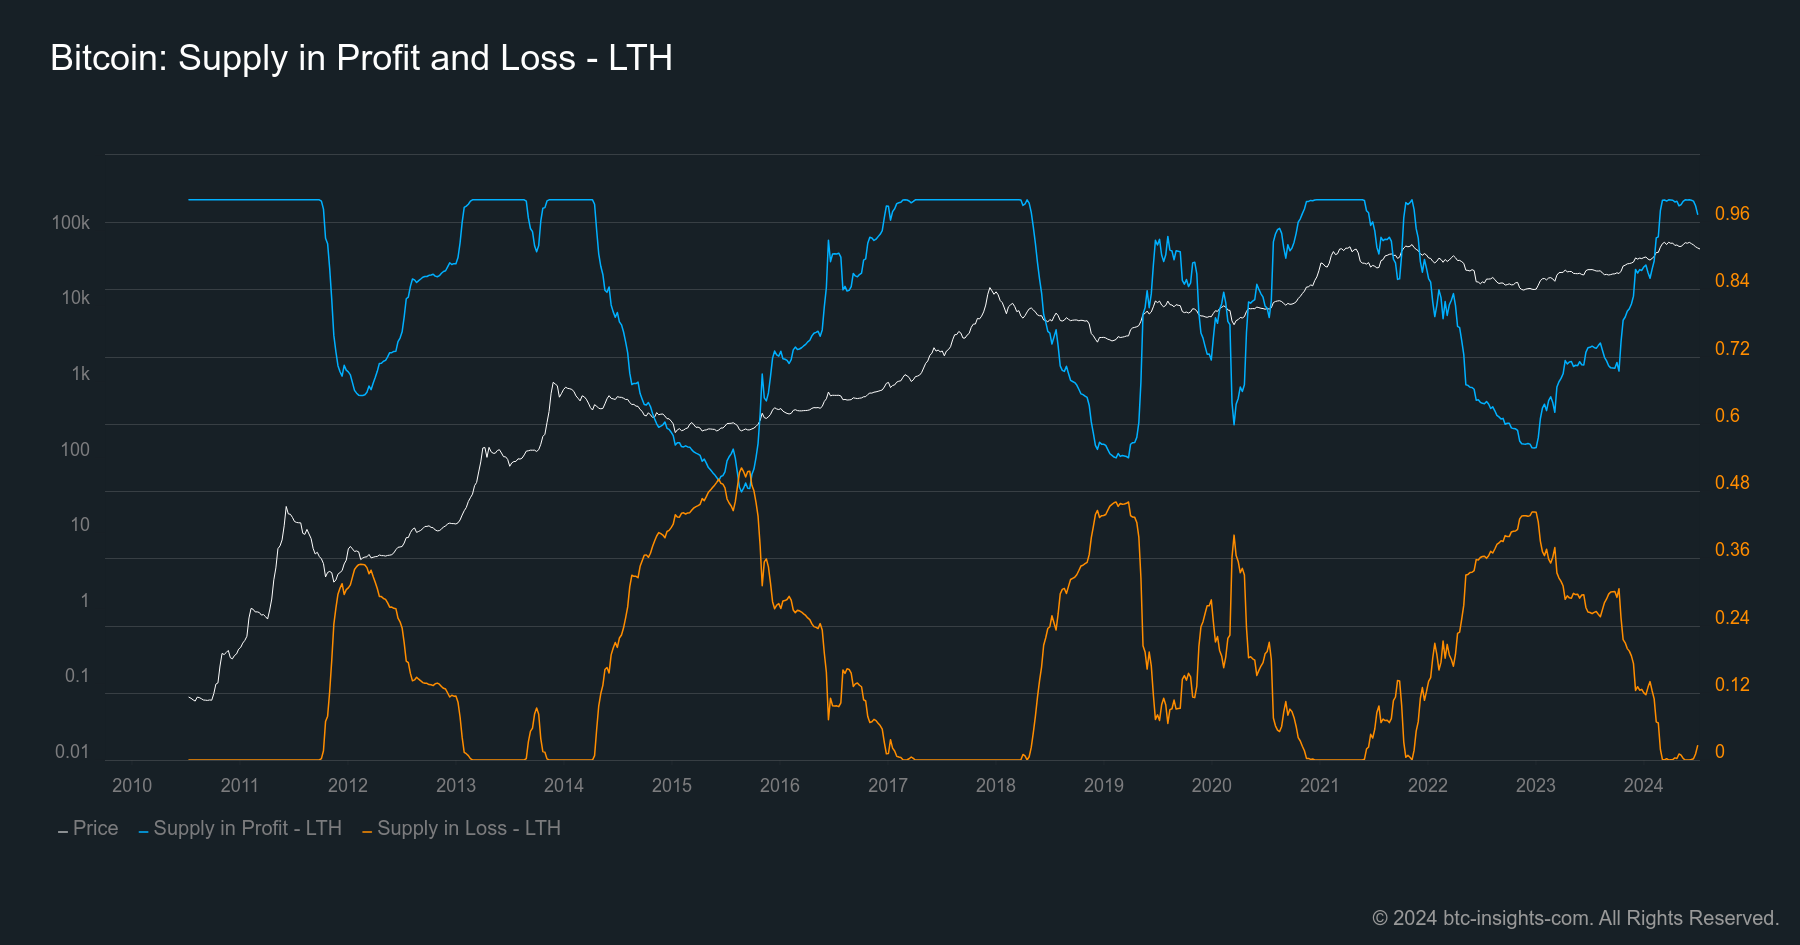
The long-term supply in profit or loss tracks only the supply that was last moved more than 150 days ago. It tends to have very long periods of binary values for supply in profit (1) and supply in loss (0) when the Bitcoin price is above the last all time high in price exploration mode.
As mentioned before the metric also takes into account lost coins and those that haven’t moves within years. That’s why the bottoms of the supply in profit generally tends to trend higher as coins from early times moved with very low prices.
The live chart can be found here.
Comparing LTH and STH Supply in Profit and Loss
Short-term holder Supply in Profit and Loss is much noisier than the Long-term holder. Therefore, Short-term holder can best be used when analyzing shorter term price action whereas Long-term holder as well as the over all Supply in Profit and Loss metric provide good insights in Bitcoin cycle tops and bottoms.
Conclusion
The supply in profit and loss is a helpful metric in highlighting periods when the market could top (when holders take profits) or bottom (when sell pressure is very low and investors are willing to reenter the market).
Author's Disclaimer: This article has been written for informational purposes only. It shall not be seen as financial advice in any shape or form.
