
How to Start with On-Chain Analysis - A Beginner's Guide
What is On-Chain Analysis?
On-chain analysis refers to the analysis of data that is stored on a blockchain. Therefore, it is unique to crypto and cannot be compared to the study of investing in traditional assets. The most prominent blockchain is the Bitcoin blockchain.
We use on-chain analysis to gather insights into the behavior of various market participants such as buyers, sellers, or Bitcoin miners. As market price is driven by emotions and psychology, understanding the current state of the market is crucial to investing wisely.
Understanding Blockchain Data
Roughly every 10 minutes, a new block is mined. It is added to Bitcoin's blockchain in a way that it stores references to the block mined before. A block then contains a set of transactions. The block itself stores information about its height (the current number of the block), the number of transactions included, the size in KB, and a timestamp. Every transaction, at its core, contains the address of the sender, the recipient, and the amount being transferred.
Unlike transferring fiat currency, all transactions stored on a blockchain are publicly available to anyone who is interested. They can be accessed, for example, with a block explorer such as btcscan.org.
At the time of writing, 850,667 blocks have been mined so far with a total size of 583.77 GB. This is so much data that it is impossible to analyze by browsing through a block explorer. Here comes on-chain analysis into play.
Two Important Concepts to Understand When Analyzing On-Chain Data
Although data derived from blockchains are pure facts, two aspects are very important to understand when analyzing on-chain data:
- One entity (for example, one person) can have multiple addresses that belong to it. This is the case when an entity has multiple wallets it interacts with. The number of people owning Bitcoin will, therefore, always be lower than the number of unique addresses in the network.
- Not every transaction is a buy or sell activity. When analyzing transactions, one is tempted to think of every transaction as buying or selling, especially when analyzing whale activity (activity from wallets with a large amount of Bitcoin in them). In reality, many transactions will just be shuffling Bitcoin around, for example, sending it to cold storage, to exchanges, or splitting a larger amount across multiple wallets for security reasons.
Key On-Chain Metrics
On-chain analysis takes all the blockchain raw data and transforms it into insightful, often actionable metrics by aggregating and combining.
On-chain metrics can be divided into different subtopics such as network statistics (like hash rate and mean block interval), mining statistics (like Puell multiple and thermocap), address statistics (like active addresses and address balance count) or supply statistics (like supply in profit/loss and HODL waves).
On-Chain Indicators for Network Health
Hash Rate
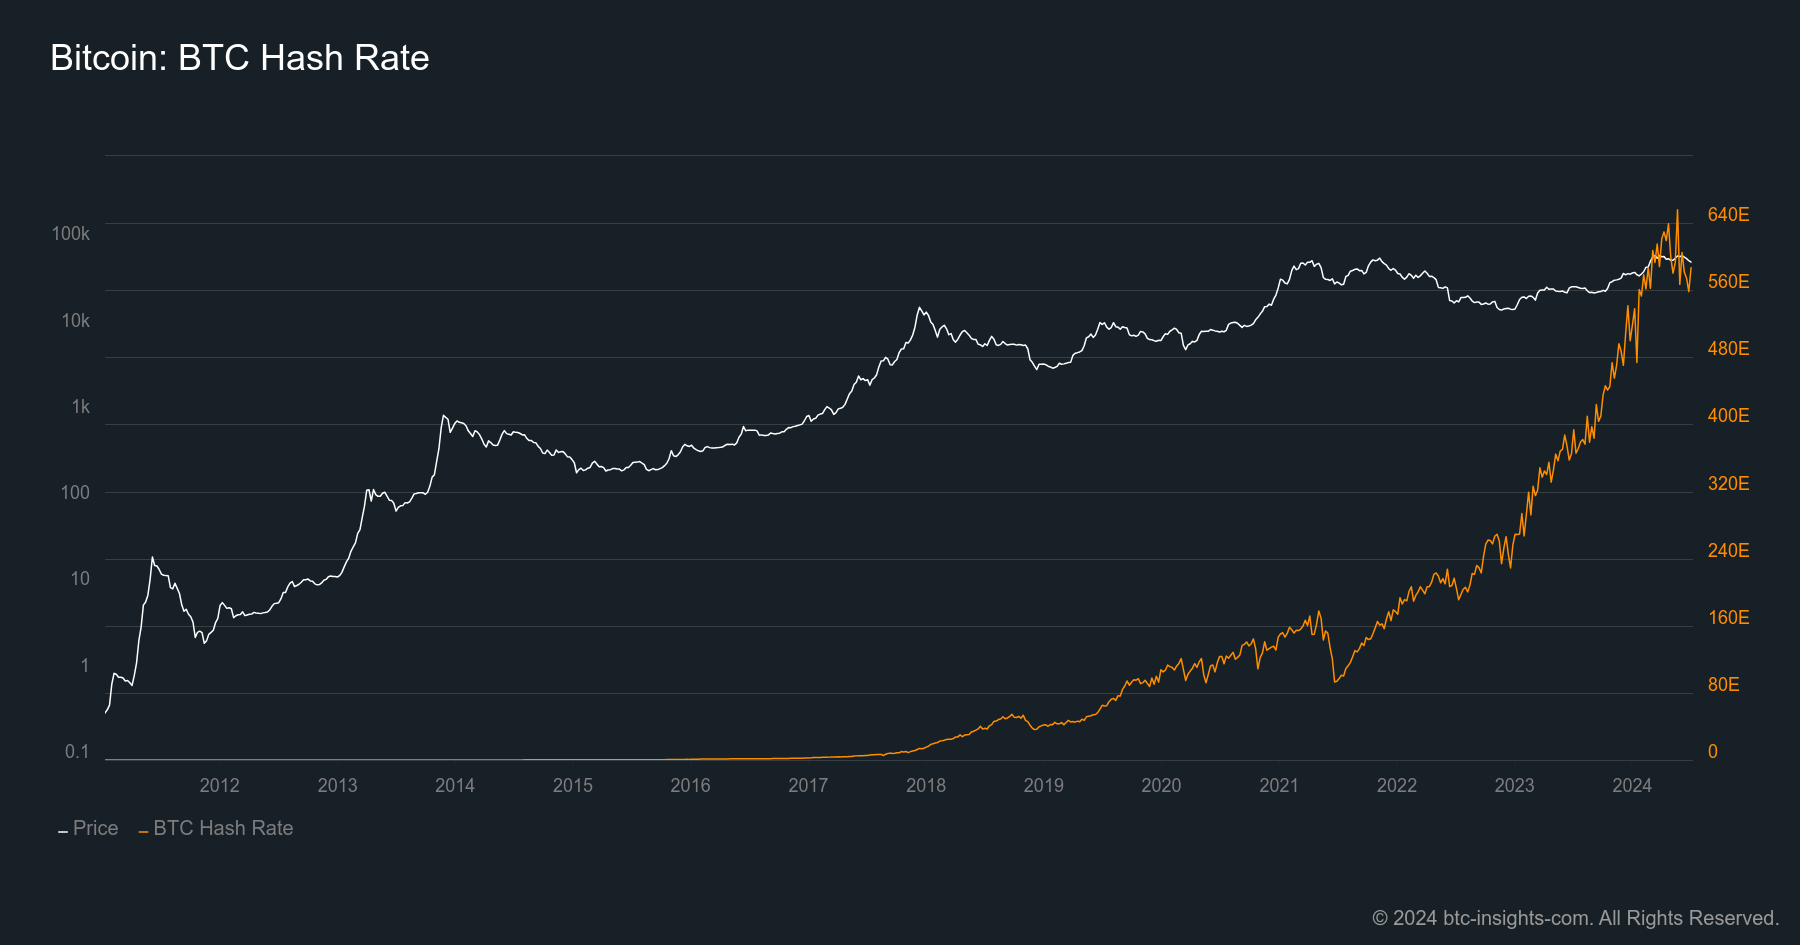
The hash rate is the average estimated number of hashes per second produced by the miners in the network. It is often seen as the key to network security and stability. A high hash rate indicates that miners are very active and securing the network with their computational power. A falling hash rate is therefore often interpreted as a warning signal for investors.
Number of Transactions
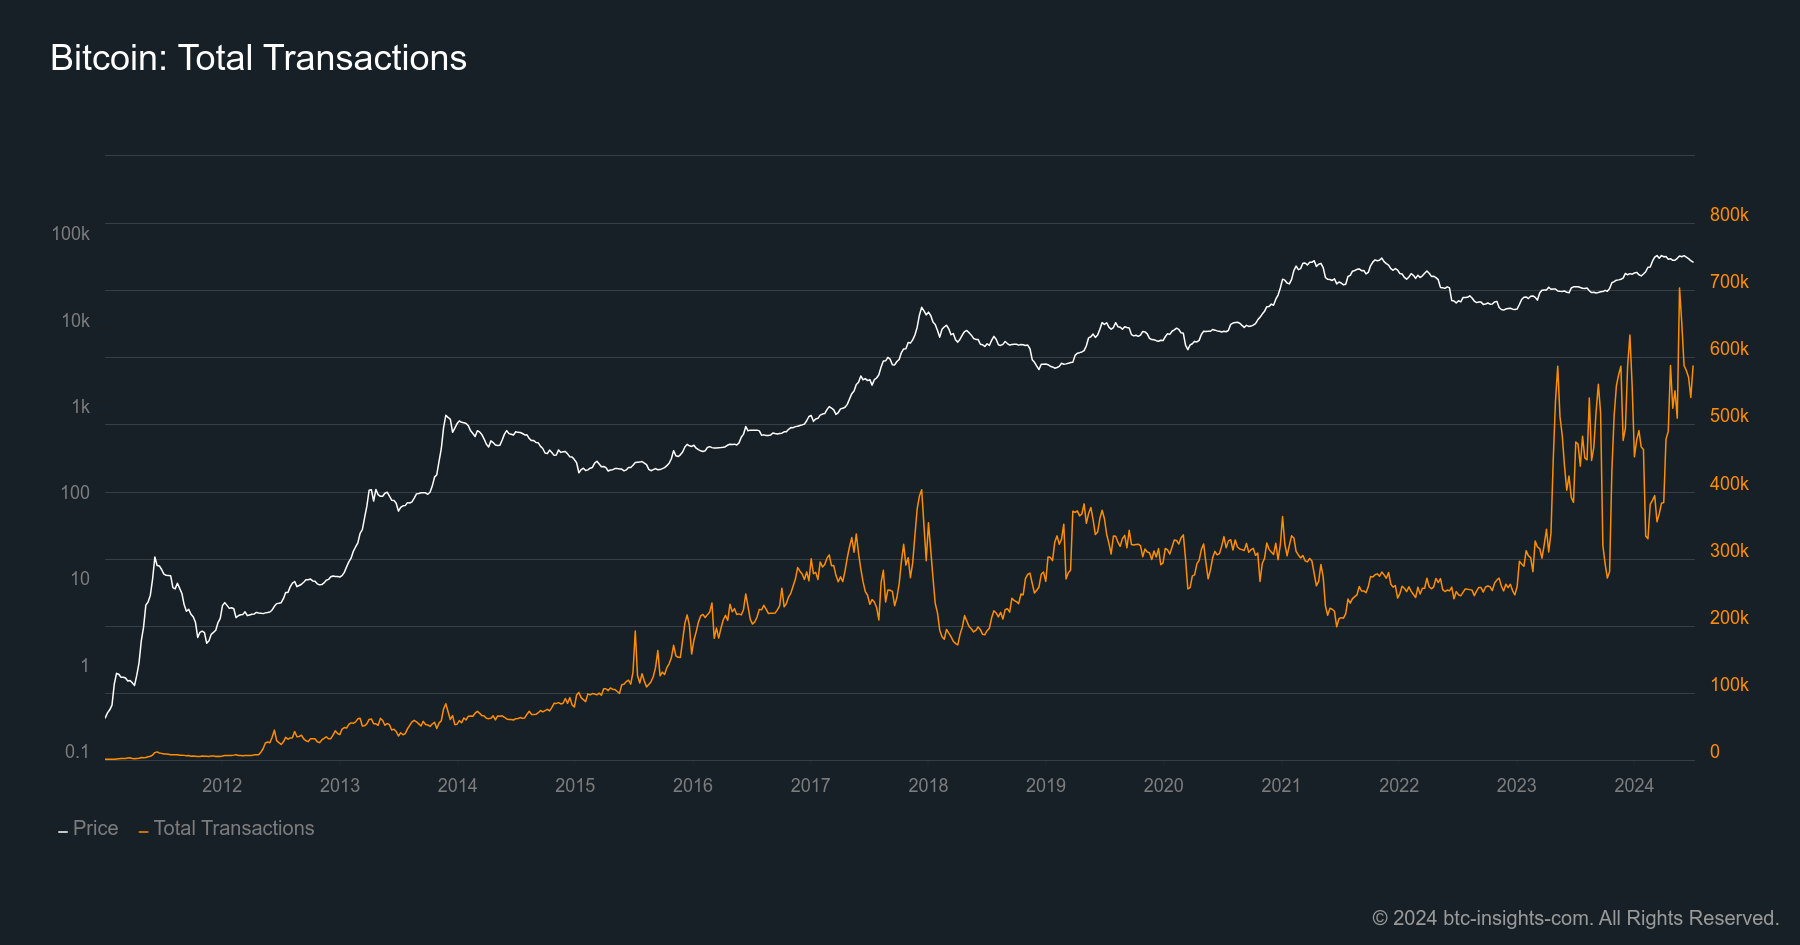
The total number of transactions per day is often seen as a measure of interest in using the network. Still, it has to be taken into account that nowadays about 40% of all outputs are batched into a single transaction (Source: Hasu's Analysis), which makes the interpretation of the number of transactions harder.
Daily Active Addresses
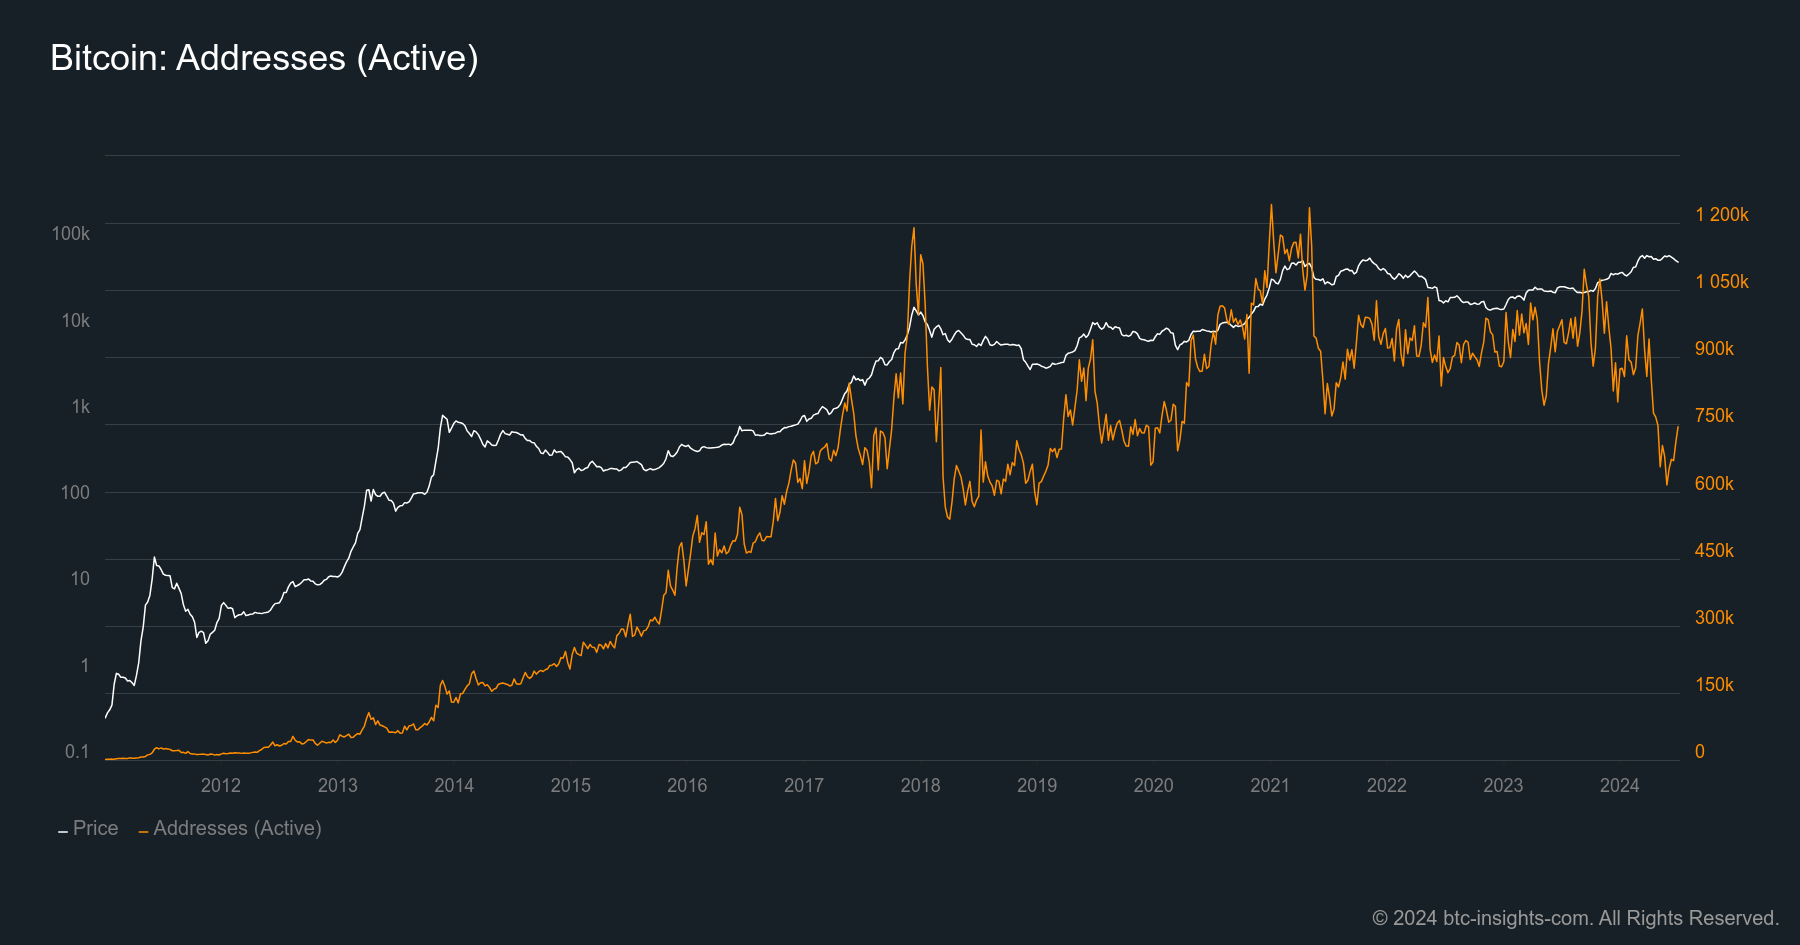
The number of daily active addresses is crucial in tracking the activity of the blockchain and, therefore, measuring the adoption of the network. Daily active addresses are the number of unique addresses that act as a sender or receiver of a transaction within one day.
On-Chain Indicators for Market Sentiment
Market Value to Realized Value Ratio (MVRV)
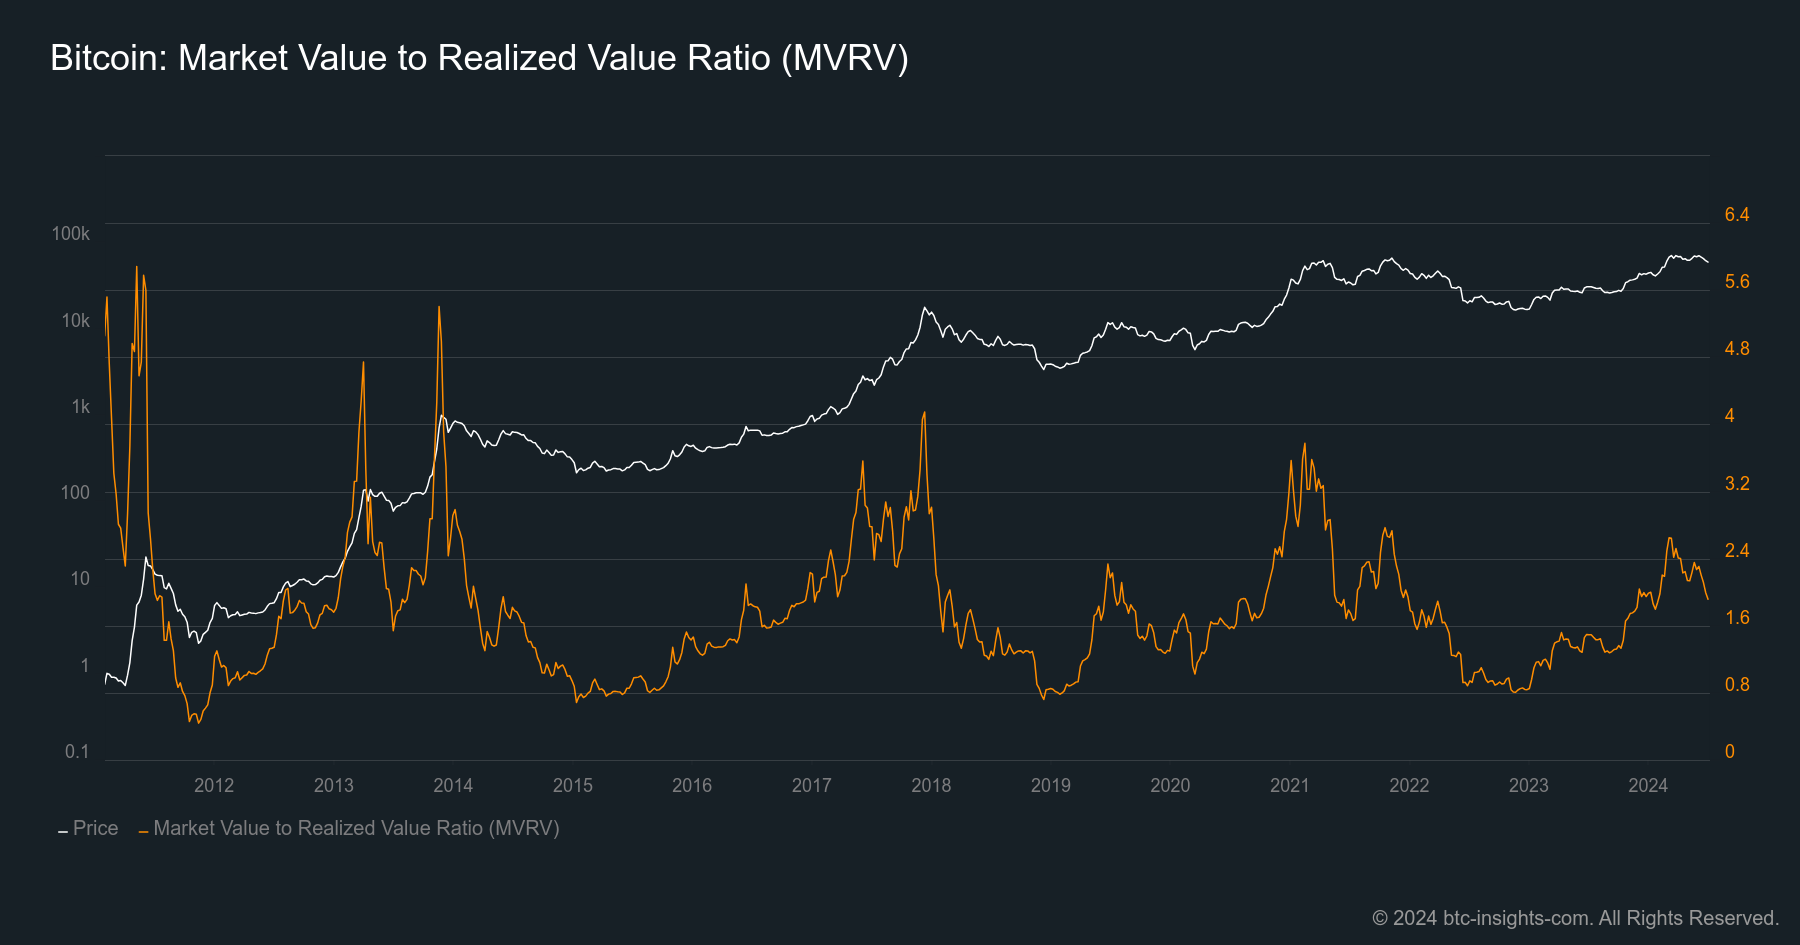
The MVRV is the ratio between the market cap and realized cap. It shows when the current market value of Bitcoin is much higher or lower than the realized value. The realized value is the value of each Bitcoin when it last moved, which can be interpreted as the cost basis of the investors.
The MVRV is an oscillating metric that makes it especially useful in understanding the current state of the market. Historically, when the MVRV ratio falls below 1, major bear market bottoms occurred. In this region, the price of Bitcoin is considered undervalued. On the other hand, when the MVRV ratio climbs above 3.5, the bull market was almost over and a severe price decline was most likely.
Puell Multiple
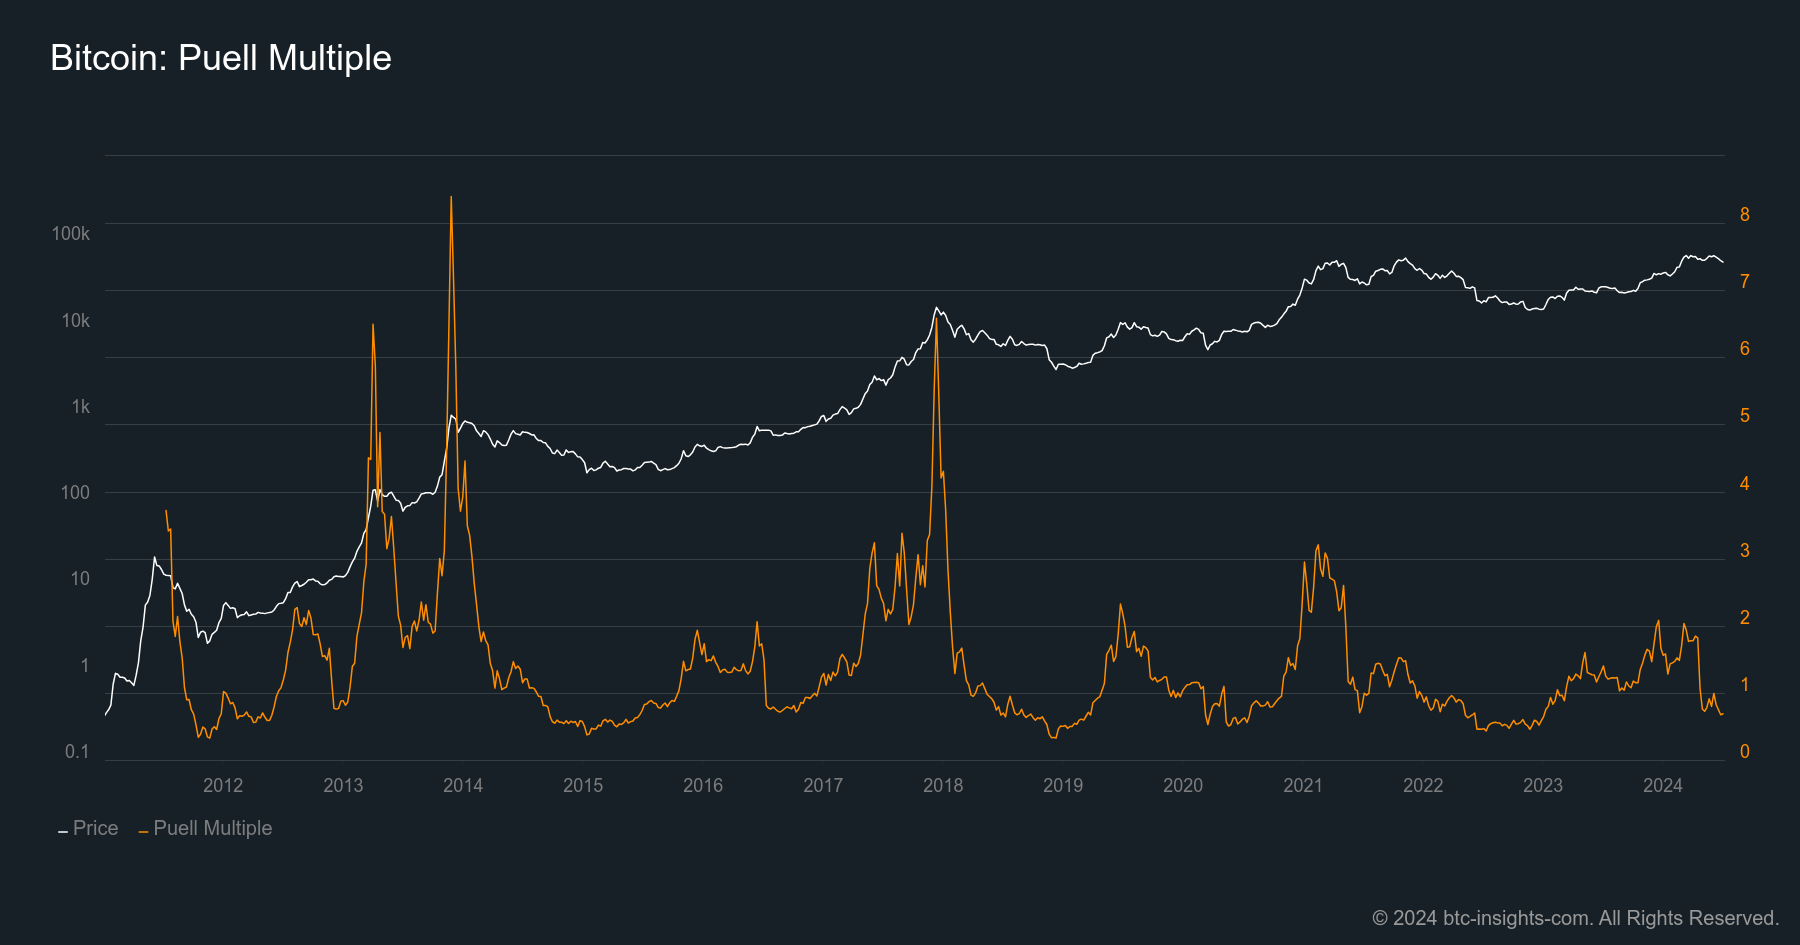
The Puell multiple is another oscillating metric. It is defined as the daily issuance value of Bitcoins (in USD) divided by the 365-day moving average of the daily issuance value. It is used to assess the state of Bitcoin mining revenues compared to a longer-term average.
If the Puell multiple rises, it indicates that miners' revenue is increasing significantly compared to the cost they put in. If the Puell multiple decreases, it indicates that miners' revenue is decreasing significantly compared to the cost they put in. When the price of Bitcoin falls to the point where miners can't handle the cost of electricity, some miners will be forced to stop their mining action.
Spent Output Profit Ratio (SOPR)
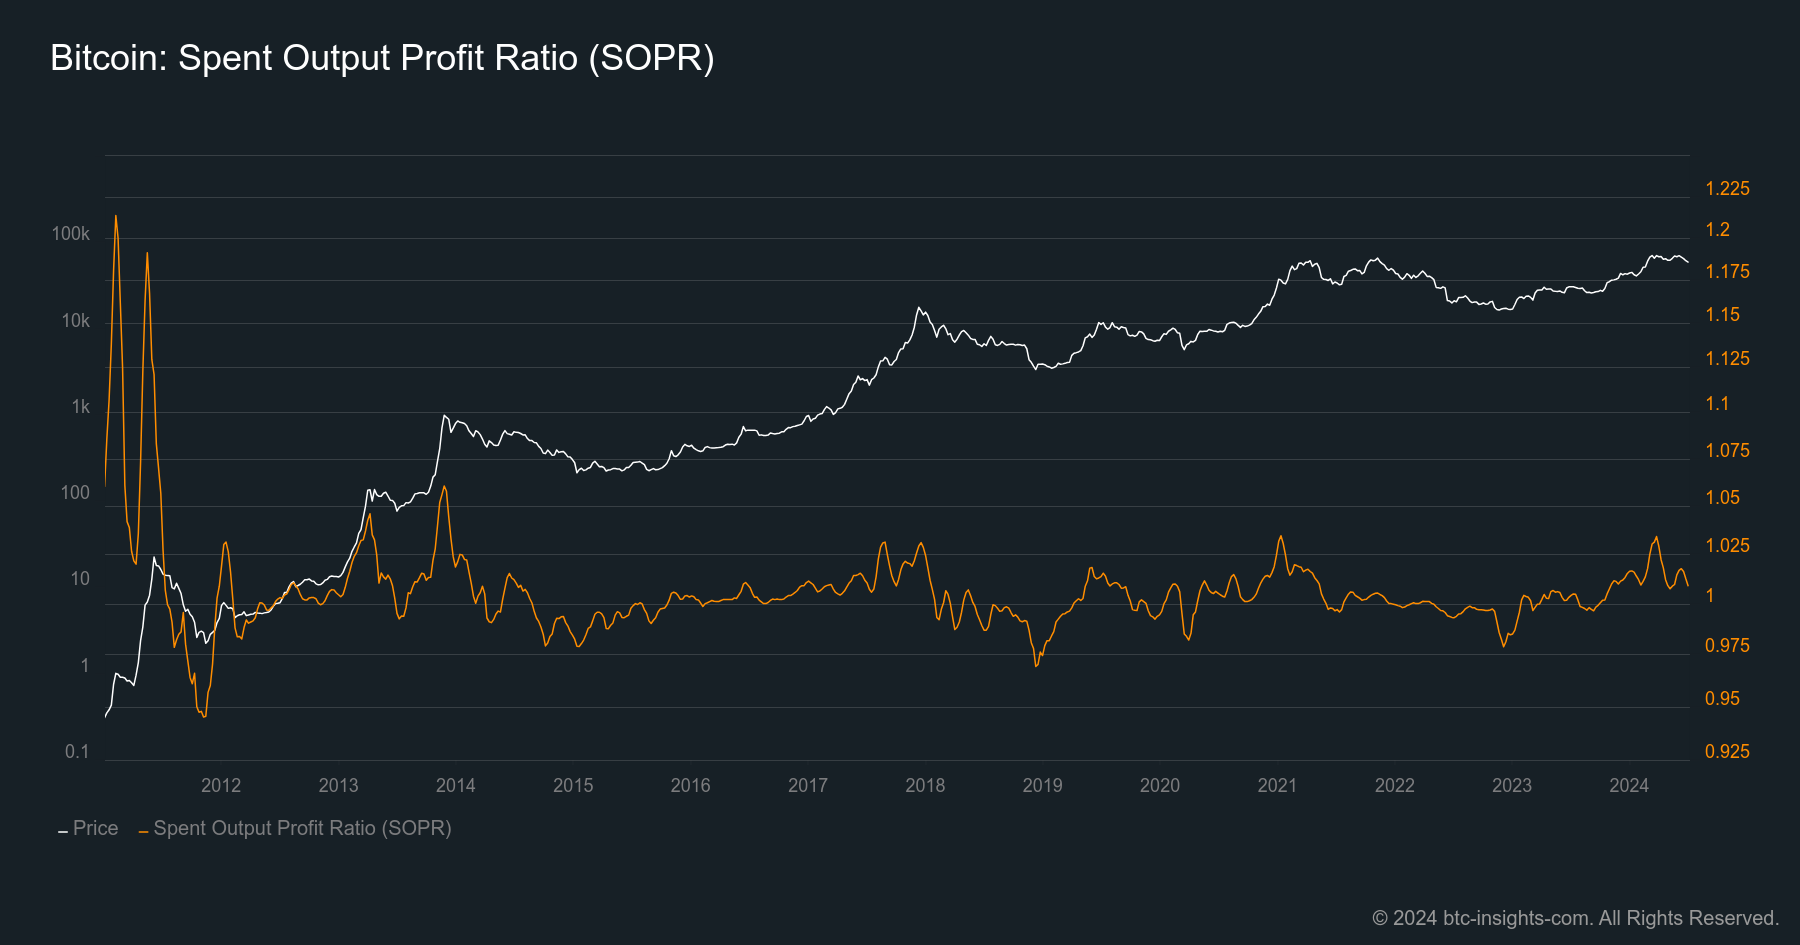
The SOPR is the realized value in USD of a spent output divided by the value at the time of creation. It shows if holders sell in profit or loss (assuming every outgoing transaction is a sell). Therefore, it provides a good insight into the market sentiment. If holders sell at a loss, this indicates a fearful environment.
A SOPR value above 0 indicates an overall sell in profit, while a value below 0 indicates an overall sell in loss. As SOPR is a very fluctuating metric, it is best analyzed by taking a moving average (e.g., 30 days). When doing so, one can see that positive SOPR over a long time occurs mostly in bull markets, whereas negative SOPR values can be seen in bear markets.
Applying On-Chain Analysis – Best Practices
To get you started, we collected some best practice tips for applying on-chain data:
- Always look for confirmation through multiple metrics.
- Many on-chain metrics are noisy and very volatile. Apply a moving average to look through the noise.
- To get a rough idea about the current state of the market, start with oscillating metrics and study the history.
- Keep in mind that while the data is factual, the interpretation can vary and there is no single truth behind it.
Summary
Blockchains offer full transparency and integrity, allowing anyone, anywhere, at any time, to access and analyze all transactions. Nevertheless, it can be overwhelming to start with. When adding on-chain analytics to your investment decisions, pick three or four metrics and study them. By understanding the basics, you are ahead of 99.9% of crypto investors.
Author's Disclaimer: This article has been written for informational purposes only. It shall not be seen as financial advice in any shape or form.
